At the end of each year, we reach out to ICA members and ask them various questions about their businesses in the past year as well as what they're expecting for the year to come. Our ICA members never disappoint, providing us with information that gives us an in-depth look at the state of the catering industry.
In this article, we explore some of the most interesting statistics gathered. Read on for findings about the industry, catering trends and business observations.
How do you compare to industry peers?
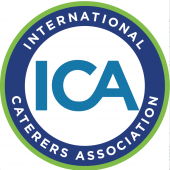
First, let's take a look at some basic characteristics of ICA members. In the United States, they hail from every corner of the nation, though just over 30% operate in the Northeast. Another 22% cater in the West, 20% in the Midwest, 19% in the Southeast and just 8% serve the Southwest. We also have ICA members across the globe, representing 1%.
In terms of revenue, a third of caterers surveyed generate annual gross sales of $1 million to $2.5 million, and just over a fifth record sales of $2.5 to $5 million. You can see the full breakdown of annual gross sales in the chart.
Is business up or down?
2016 was a pretty good year for caterers, with over 78% reporting that business was up. Even more are predicting that 2017 will be a better year, as almost 92% are expecting business to increase. We certainly hope so!
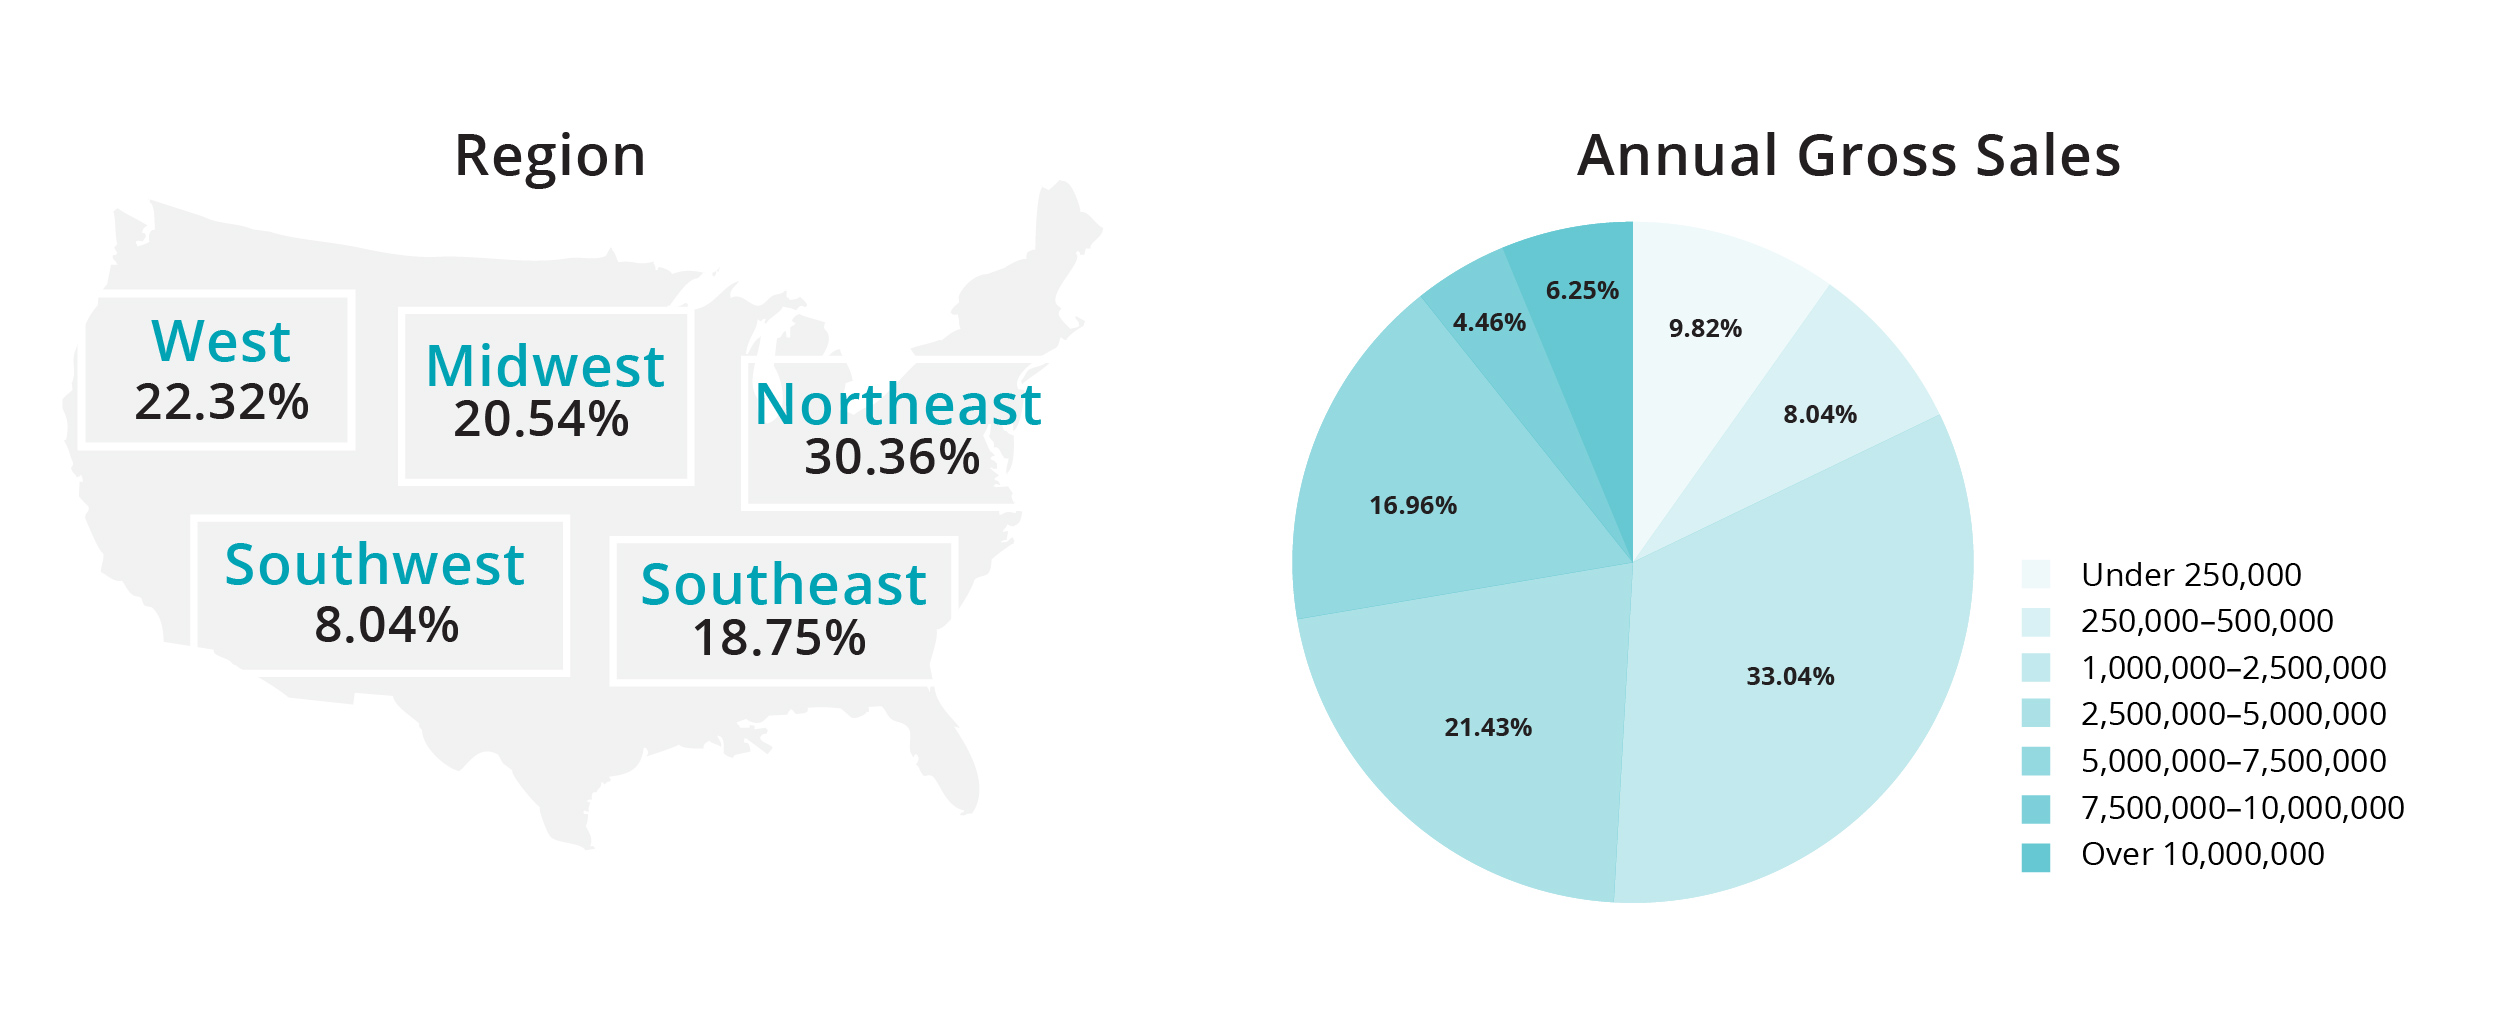
The biggest challenge that caterers faced in the past year was staffing, as 46% of members surveyed reported that was the main business issue they faced. Another 11% said that marketing and sales were their biggest problem, and 9% had difficulties with money and profitability. Look to the chart for the full results.
In more uplifting news, nearly half of surveyed caterers reported their biggest area of growth was corporate events, and almost 38% said weddings was theirs. An additional 6% stated that social events grew the most and 7% saw growth in other events.
What do clients want?
This is one of the most frequently asked questions for business owners, and our caterers had a lot to say about it. The most popular cuisine in 2016 was American (39%), followed by farm-to-table (18%). Take a look at the chart to see other trending flavors.
Accommodations for dietary needs are also on the rise, particularly catering for vegetarians, gluten-free diets, and vegans. Dairy-free, nut-free, and paleo are also commonly demanded.
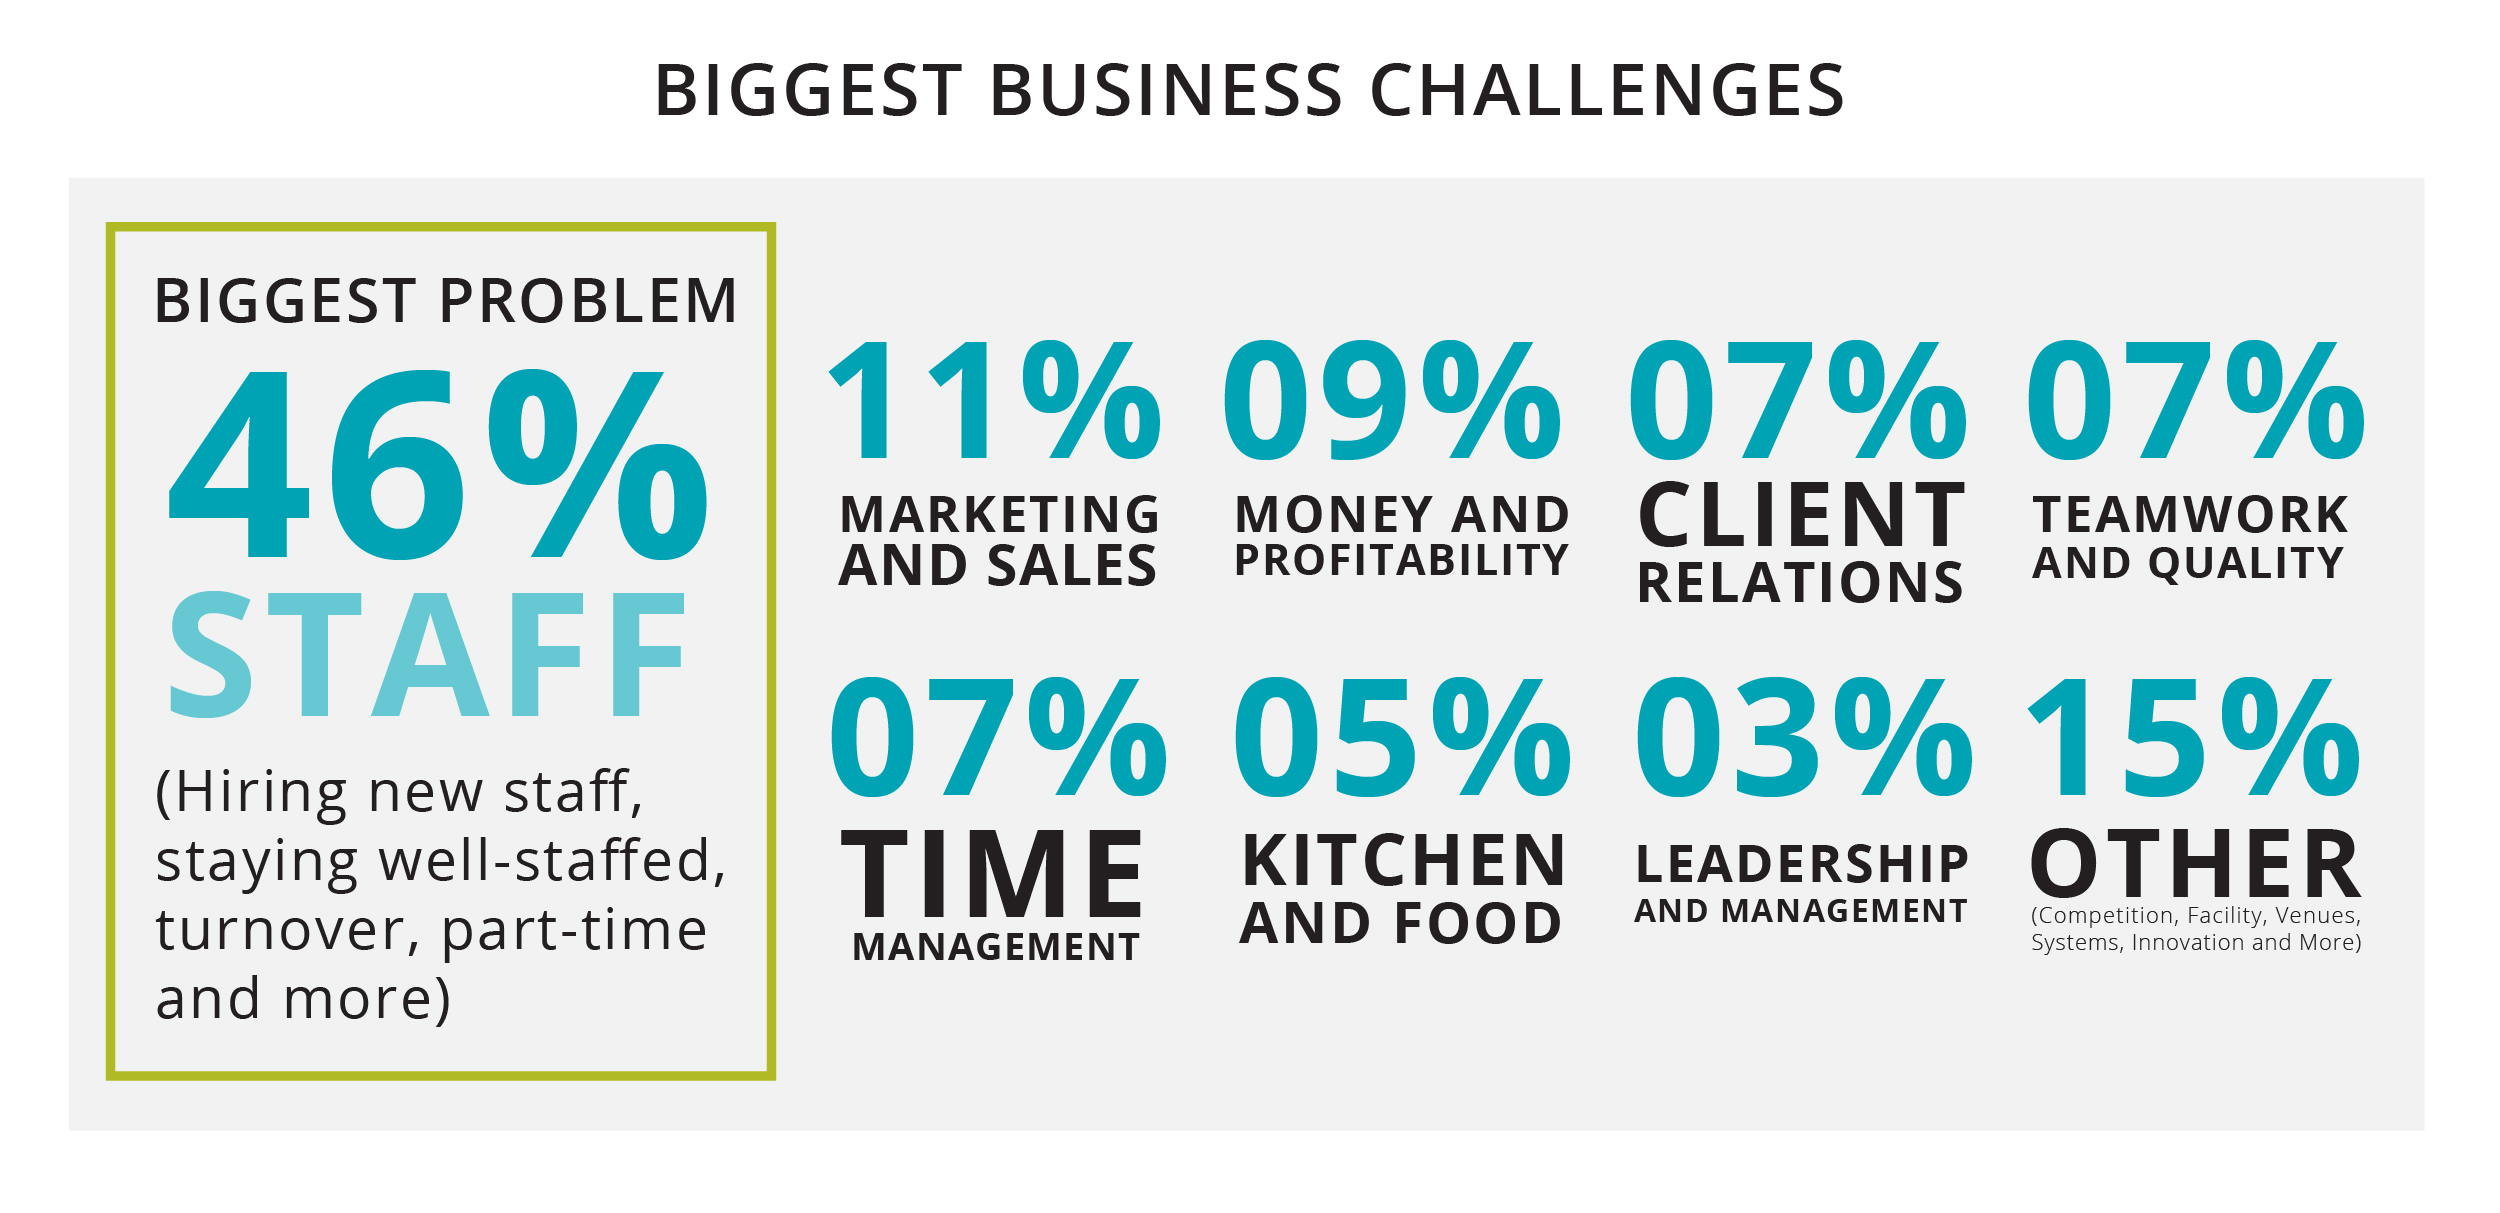
We also examined when clients typically book their events. Over 42% of ICA members reported that they received most of their bookings zero to three months in advance. Another 27% said that most of their clients booked four to six months ahead. See the full results in this chart.
How do you compare?
Have any of these results surprised you? Does your business face some of the same challenges or see some of the same trends? Throughout 2017, we'll address some of the most common problems caterers see and dig deeper into trends. Keep an eye out for our articles and interviews with expert ICA members in Catersource Magazine and on their website.
Also, we encourage you to attend Catersource 2017. It is a great way to gather with other caterers (over half of ICA members will attend!) and share industry tips, tricks, and ideas. We can’t wait to see you there, and to see your amazing 2017 events!